Ice Age Britain
Ice age Britain, and how the geography of Northern Europe was created

How did Neolithic Orcadians travel to Orkney in large numbers to build the cairns, henges, and settlements we visit today?
How did the European Vole get from mainland Europe to Orkney as the Orkney Vole without setting foot on Britain?
I have to begin with a warning that none of the story I am laying out here agrees with what is taught, and learned, of orthodox views of British Quaternary history or human Prehistory. I have read and understood the interpretations of scientists working in these fields, and have found their conclusions to be unsupported by the evidence broadly available at the present time. Neither do their conclusions agree with new interpretations which I present here, combining several strands of academic research with my own observations, for which I present clear evidence. (I hope!)
The location of the territory

Figure 1
The plan above indicates Britain, it’s neighbours, and the sea ways around it. It also shows the three major significant features in the North Sea, Dogger Bank, Witch Ground, and the Norwegian Channel.
The Norwegian Channel is a deep water trench that follows the Norwegian Coast from the Skaggerak, an even deeper section of the same trench, between Norway and Denmark, out to the North Atlantic Ocean.
Dogger Bank is an area of shallow water in the southern North Sea known to have been walkable land in prehistoric times, Doggerland.
The Witch Ground is one of a group of deep water features in the North Sea.
Norway is marked, as is Rogaland, a region of low-lying land on the Norwegian Coast.

Figure, 2, 120,000BP
The North Sea developed from a rift valley feature of significant age. Gradually this was filled with sediments from the land around it, in Britain, mainland Europe, and Norway.
Figure, 2, 120,000BP
The North Sea developed from a rift valley feature of significant age. Gradually this was filled with sediments from the land around it, in Britain, mainland Europe, and Norway.
Between 330,000BP and 140,000BP there were fairly consistent ice sheets on mountainous areas across the globe, and Sea level was low, perhaps more than 100 metres below present.
Between 140,000BP and 120,000BP temperatures rose considerably higher than they are at present and sea levels rose as land based ice sheets melted. During this period the North Sea may have been a reasonably quiet marine lagoon whose only oceanic front was at the North between Shetland and Norway. (See above)
Rivers of rainwater and meltwater draining from mountains in southern and Eastern Europe flowed into the North Sea, and then out onto the Atlantic Ocean.
However, the Gulf Stream, bringing warm water, and air, from equatorial America was sending a continuous barrage of stormy weather to the western coasts of Britain.

Figure 3, From 120,000BP to 70,000BP
The last ice age was a period that started around 120,000 years ago and ended about 10,000 years ago. It was a block of time in which temperatures were generally lower than they are today. The effect that icy temperatures had on different locations around the globe created very different climatic events, with very different impacts and results.
Put simply, the ice age in north-western Europe, controlled by the Atlantic Gulf Stream was very different from that in Greenland or Antarctica, but those are the places in which our technical understanding of ice sheets is most intently studied. Therefore we cannot say that because "it" happened in Greenland, that's the way it happened here.
This period was the last of a sequence of ice ages that had been modifying the face of north-western Europe for a million years.
In spite of raised sea levels 120,000 years ago, it is possible that the English Channel was not cut through deeply enough to permit the flow of Atlantic water through the Dover Strait to the “North Sea” by that route.
The first period of very low temperatures within the last ice age peaked at around 70,000 years ago. At that time ice covered most of Britain, but not necessarily all of it. (See above)
The ice sheets were essentially static. When they “advanced” they did so as a result of new laying precipitation, snow on dry ground.
When they retreated the surface of the ice sheet melted as a result of warm air from the Atlantic Ocean flowing over it.
The warm air caused meltwater to drain as waterfalls at leading edges, creating eroded surfaces where the water fell, and pudding of the meltwater. Puddling water then undercut the edge of the ice sheet which collapsed.
Close to warm water , like the Norwegian Channel and the Atlantic Ocean, small collapses of thin ice sheets had less effect upon the underlying geology, but as the edge retreated, and as the ice sheet thickness increased, the damage caused by the falling ice was more profound.
Where the thickness of the ice was sufficiently great a linear valley was caused to be cut in the underlying geology. The valley that was thereby cut could be modestly sized, or massive. Many of the valleys across the British landscape have been cut in this way, sometimes repeatedly as glaciations have come and gone in the last million years.
As a by-product of the excavation of the valleys, huge amounts of broken rock, ice shards, and meltwater were pushed out to low lying land, and shallow seas all around the British coastline.
This is best demonstrated in the seabed around Shetland where the Ferder Formation, (FD), almost completely surrounds the Shetland group of islands. (See below)

Figure 4
The plan shows the location, and direction of view of a section across the seabed between the Northern tip of Shetland at the west, and the Norwegian Channel at the east.

Figure 5
That section drawing above is somewhat distorted, in horizontal scale, but shows that the sediment layers falling away from Shetland are likely to have drifted down hill away from the island group. The Shackleton Formation, (SHN), the Mariner Formation (MRN), and the Ferder Formation (FD), are all sloping away from Shetland, and would have been cropped by the period of high sealevel between 140,000BP and 120,000BP.
Above those layers, in section, are the Capeshore Formation (CSO), which was laid between 120,000BP and 24,000BP.
The Sperus Formation, (SPE), and Tampen, (TAM), Viking Bank (VKB), NorwegianTrench (NT), and Kleppe Senior (KSE), are all likely to have arrived after 24,000BP. These layers are likely to have arrived from the cropping of older deposits during the deglaciation period.

This image is from "The Pleistocene Glaciations of the North Sea basin" by Alastair G.C. Graham, et al. It marks in a highly simplified form the current knowledge base around which the understanding of glaciations in Britain are understood. The plan and section of the Shetland Isles and the Formations around it demonstrate that the island group are a source of glacial sediments, and that they radiate out from there in all directions. There is no recognition of this on the Alastair Graham glacial map above.
In the section, the relationship of the Ferder Formation with the bedrock of Shetland demonstrates that the strata does not begin at the highest point of mainland Shetland, but at the base of the island, and is separated from land by a series of valleys cut into the bedrock thereof.
None of the layers of sediments present in the section arrived in their final resting place as a result of being carried by glaciers, or any other form of ice. They are all water transported.

Between 70,000BP and 50,000BP the ice sheets collapsed at lower altitudes and latitudes. The resulting sedimentation caused by this collapse sent watery sludge out from Shetland as the Capeshore Formation, and out from Scotland and England as the Coal Pit Formation. At the same time glacial sludge from the European Alps ran north to meet the Coal Pit Formation, settling and forming the Dogger Bank.

From 50,000BP to 40,000BP continuous meltwater runoff from the English and Scottish ice sheets carved into the top of the Coal Pit Formation creating a suite of deposits along the British coast. At the North, buttressed by the Capeshore Formation, was the Swatchway Formation. South of that was the Marr Bank Formation which was joined by the Wee Bankie and Bolders Bank Formations. Even at present the Marr Bank is deeper than the area here marked as "Coal Pit", and would have been prevented from draining away to the north or to the east. The Marr Bank then, was a shallow lagoon that overflowed from this pocket by making its way around the south of the Dogger Bank, leaving the Wee Bankie and Bolders Bank Formations, and reaching the Atlantic Ocean along the Norwegian Channel.


Above, the locations of the Marr Bank, Wee Bankie and Bolders Bank are defined, the sections across the deposits, and the location of the Bolders Bank.
An instance of how the climate was warmed during this time, at 43,000BP, is described by Peter Kent :- “Fluvial sand and gravel exposed in quarries near Tattershall contain evidence of a short but marked mid-Devensian climatic amelioration (Girling, 1974). An organic silt bed within involuted gravel overlying the Ipswichian peat has yielded insects indicative of a high-latitude continental tundra environment, but a slightly higher bed contains a thermophilous insect fauna—some taxa of which are now confined to southern Europe—implying summer temperatures at least as warm as those of southern England today. Radiocarbon dates from these deposits and correlatives elsewhere in England show that this warm interval, the initial phase of the Upton Warren Interstadial Complex, occurred around 43 000 years ago. It was too brief for the climatic improvement to be reflected in the flora. The overlying sand and gravel in the Tattershall area are appreciably cryoturbated and contain numerous remains of mammoth (Mammuthus primigenius), woolly rhinoceros (Coelodonta antiquatis), bison, reindeer and other tundra-favouring mammals.”
Ice sheets build to their maximum extents from 43,000BP to 24,000BP

Full ice age conditions returned after 43,000BP. The ice sheets on high ground had continued to add thickness since 70,000BP, and from 43,000BP a lowland ice sheet was laid by thick seasonal snow, from Ireland, to the English Channel, to Shetland, and to the Norwegian Channel.
The ice sheet over the Marr Bank Lagoon was probably either thin, or absent.
The weight of the ice mass over Britain and other glaciated geologies caused the earth’s crust to be forced down into the molten magma, locally, at a depth that was probably proportional to thickness of ice. The value of this ice thickness measure is probably best estimated by the measurements of sea level change over the last 20,000 years.

The map above indicates relative sea-level data points around the British and Irish coastline. The areas where the earth’s crust has been most affected by glacial ice overlaying it are represented by brown dots, and those least affected are black dots.
It may be estimated that brown dots may have had over a kilometre of ice sitting on them while black dots may only have had from zero to over 200 metres of ice on them.
The final retreat of the ice sheets after 21,000BP began in southern Europe, sending meltwater north towards Dogger Bank, and down the Norwegian Channel to the Atlantic Ocean. In addition rising sea levels and a warm Gulf Stream sent tidal waters up the English Channel, up the Irish Sea, around the Outer Hebrides, and down the Norwegian Channel from the north.
In some places melting of ice sheets began before 21,000BP, but it was at that date that the English Channel and Dover Strait appear to have been cut through. A palaeovalley in the English Channel is dated to have been cut at that date. As the ice sheet over southern England receded, it cut this group of subsea valleys in the English Channel, parallel to the English coast. These have been recorded and dated by Mellett et al to 21,000BP. They are also likely to directly relate to the Lobourg Channel, a deep water region that slices the seabed between Dover and Calais.


Figures 13 and 14 plan of the English Channel showing location of the section G-G’

Figure 15 plan of Lobourg Channel in the Dover Strait
Bathymetry of the Dover Strait between Dover and Calais, the deep water region is the Lobourg Channel .


Figure 16
A particularly good, and characteristic set of parallel eroded valleys in western Herefordshire, these are a feature of the British landscape , often filled with ribbon lakes, and more often falling in two opposite directions from a middle point high. This topography denies the possibility that these valleys could have been caused directly by horizontal movement of solid ice.


Figure 17 contour map of ridge system across Norway and Sweden. This is a dramatic example of the retreat pattern of parallel valleys progressing northeasterly across Norway and Sweden towards Finland.
Direct warm air from the sea caused erosive valleys to be cut parallel to the Atlantic coast, and as airflows rolled over the colder interior ice sheets of Scandinavia the leading edge, southwest facing, collapsed leaving the linear valleys, now with ribbon lakes and rivers in them.
At the North of the North Sea, deglaciation spread south-westward away from the Norwegian Channel, arriving at the palaeovalleys filled by the Witch Ground Formation at around 18,000BP, see below. Deglaciation then reached Orkney, cutting the Westray and Stronsay Firths that divide the northern islands of the archipelago from the mainland group in 16,000BP.

Figure 20 geological map of Witch Ground Formation presence, including as infill of a parallel Valley system
How the Central Belt of Scotland sank to allow sea water to cross from the Irish Sea to the Witch Ground at around 15,000BP

Figure 21, 16,000BP
When the ice sheets on low lying land had melted away, those on mountains remained. The collapsing ice had created deep palaeovalleys across the whole of the British Isles and in the surrounding terrain. Features like the Outer Silver Pit, south of Dogger Bank, the Witch Ground, and the Devil's Hole in the North Sea were cut at this time.
While the ice sheets on Scotland remained, their presence pushed the land down, enabling marine water to nibble at the ice sheet crossing Scotland along the Central Belt. This caused the Glasgow/Edinburgh areas to allow sea water to pass from the Irish Sea to the east coast of Scotland salinating the Witch Ground Lake and the Marr Bank Lagoon.

Figure 23 presents sample graphs showing groups of blue dots, which are data points indicating presence of marine deposits in the specified locations. They illustrate sea level change in five coastal locations in Scotland “13”,”15”, "16" "17" and “20”.

Figure 24 The data points featured above are marked on the map. Those positions suggest that sea water was reaching the Witch Ground Lake from the Irish Sea at around 15,000BP.
The area around the North Channel of the Irish Sea was, at the time, compressed down to a depth in excess of 100 metres below our sea level. Running up the Irish Sea, the sea melted the ice sheet where it lay in the central belt , allowing sea water to run freely to the east coast of Scotland.
The character of the deposits on the Witch Ground is defined by Fred Jansen, suggesting the nature of the waters that were retained within it.
"During the development of the Lower Witch Deposits , (an early infill for the Witch Ground) a better connection with the open ocean was gradually effected, as is demonstrated by the Foraminifera content. (marine waters from the Irish Sea infiltrating through the low Central Belt of Scotland to salinate the heretofore fresh water Witch Ground Lake.) The two mollusc samples investigated point to still arctic conditions (suggests a non-tidal environment)" (Jansen),
Sea level had not risen sufficiently highly, at this time, that salt water could have entered the Witch Ground /Marr Bank Lagoon from the Norwegian Channel, and around the south coast of Dogger Bank.
After 15,000BP the land of the Central Belt of Scotland rose up again, enclosing the Witch Ground and Marr Bank as an inland sea with no direct access from tidal oceanic water “A poor ostracod fauna and a moderately abundant population of foraminifera (Thomson, 1978) indicate that the shallow waters in which the (Marr Bank) formation was deposited were high-boreal to arctic in temperature, and inner shelf to estuarine in character” (Gatliff). “Estuarine” means that this sandy deposit was laid down in an environment that was not fully marine. This inland sea was then maintained at a heightened water level by rain and meltwater runoff from England and Scotland and was unable to drain completely around the south coast of Dogger Bank, It was also not accessed by the Atlantic Ocean, and therefore was non-tidal.
In this phase of deglaciation fast flowing meltwater pushed rocks south from Marr Bank and Mainland Britain, around the south coast of Dogger Bank, to join the Norwegian Channel.
The Witch Ground and Marr Bank lagoon remained as a raised piece of water, holding rainwater drained from England and Scotland until perhaps 10,000BP.
Meanwhile, on mainland Britain, how retreating ice sheets created landscape and subsea features.

Figure 25 contour map of Pennine mountains
On land, the retreat of the ice sheets reached the Pennine Hills, cutting the Trent valley. This is a huge geographic feature that follows the edge of the mountains. Major rivers feed into the valley, from both north and south. These include the Ouze and Tees from the north and the Trent from the south. As the valley is deeper at midsection than it is at its northern or southern ends, it would at one time have contained a lake which has in geological time broken through a side wall of the lake to cut the Humber Estuary releasing lake water into the Marr Bank Lagoon.
The Trent valley contains evidence of several erosive episodes that have left terrace-like areas and deposits.
An idealised depiction of a section across these terraces is shown below, with the names of the formations and the approximate age that they are believed to be.
The Crown Inn Beds and the Beeston Sand and Gravel are from the first half of the last ice age, and the Holme Pierrepont Sand and Gravel is from the deglaciation of the last ice age.
The Eggington, Etwall, and Eagle Moor Sands and Gravels are all from deglaciation of ice ages covering at least the last half a million years.
The excavated materials derived from these terraces are, today to be found in the floor of the North Sea, as the Coal Pit Formation, and possibly deposits below it.
Other obvious large landscape features that may have developed over the last million years, in the same way, include the Bristol Channel, the North Channel of the Irish Sea, the Minches between Scotland and the Outer Hebrides, and the Pentland Firth.

Figure 26 idealised cross section of Trent valley indicating the “Staircase “ of terraces, and the approximate dating of their cutting.
 9
9Figure 27 depicts a plan of seafloor features off the coast of northern England .
The blue linear features on the plan are valleys cut into the bedrock there, parallel to the English coast. These were caused by the seasonal retreat of the ice sheet. The ice collapsed breaking up the substrate beneath it, and piling broken ice against the edge wall of the ice sheet. As meltwater began to drain through the ice mass it flowed downhill taking with it ice shards and broken stones, silts and sands. This mixture slid down slope, and any rocks within the ice mass cut the green striations in the ground it slid across. When the ice mass reached water, a lake or the sea, it melted, and the rocks that it had carried were dumped as the sediment wedge.

Figure 28 is a map of northeast England showing geological deposits in the Trent valley
The “York moraine” and the “Escrick moraine” are at the North end of “Lake Humber”, West of the Yorkshire Wolds. These moraines derive from the breakup of ice sheets higher on the Pennine Hills. An ice stream of ice and rock solids has flowed towards the Humber lakewater, melted and dropped it's load, forming the moraines. The date for this event may have been as late as 11,300BP, when the Holme Pierrepont Sand and Gravel was laid.
Deglaciation as it affected the Norwegian Channel

Figure 29 When the ice sheets had melted it is possible that some small glaciers within glacial valleys remained. The valleys had been cut by the collapsing ice sheet, and may have remained filled with ice streams that solidified in place due to poor sunshine access.
At this same time deglaciation was progressing northeast across Norway, and at around 12,000BP ice streams were flowing from the peak ridge along the length of the country, down across Sweden to the Skaggerak, a deep water trench off the south eastern coast of Sweden.
Water and ice then flowed out and down the Norwegian Channel, causing a surge in the height of the sea along the Norwegian Coast of about 10 metres.
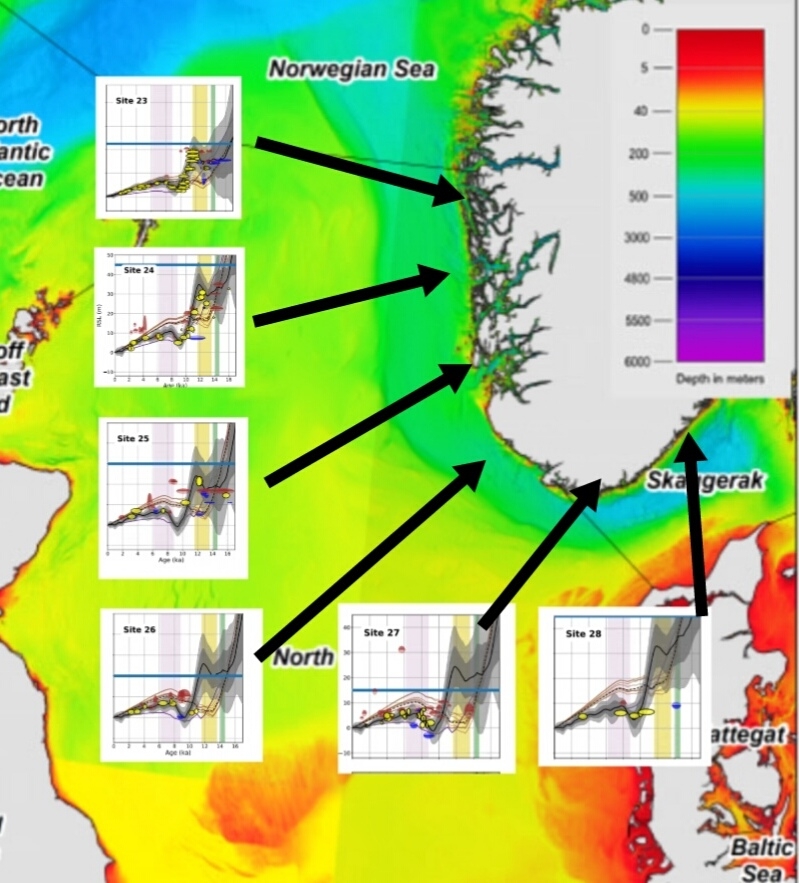
Figure 30, The graphs above show relative sea level heights for locations along the Norwegian Coast of the Norwegian Channel.
At 12,000BP the graphs all show a rise in water level of around 10 metres , peaking at that date.
This uptick is not present at any location on the Atlantic/Norwegian Coast, only the Norwegian Channel. It is likely to denote a surge of meltwater coming from the melting of the northern ice sheets of Scandinavia.
As sea level in the North Sea was between 50 and 60 metres below present sea level in 12,000BP, the level of the surge may have peaked between 40 and 50 metres below present levels.
To maintain a surge at these levels against the Norwegian Coast there would need to be a corresponding bank on the west coast of the Norwegian Channel, of at least 40 metre depth below current sea level.
The depth of the sea floor along this west side of the Norwegian Channel, and opposite the Norwegian Coast is between 100 and 150 metres below sea level. See Figure 30 bathymetry of the Norwegian Channel.
Perhaps as much as 100 metres depth of seabed material has thus been lost to tidal erosion over the last 12,000 years.

Figure 31, Sea level data for the North Sea between Germany and Dogger Bank.
The early development and collapse of the Witch Ground

Figure 32 section drawing and plan for the Swatchway and Witch Ground Formations
The Witch Ground is a deep sea feature which was created by the impact erosion of the receding ice sheet. The material that it was cut into was the Swatchway Formation, and the material that filled the impact palaeovalley is the Witch Ground Formation.
In “Late Pleistocene and Holocene deposits in the Witch and Fladen Ground area, northern North Sea” Fred Jansen divides each of these layers into Upper and Lower strata. The earliest deposits are the Swatchway Formation, of which the earliest strata is the Lower Swatchway Beds. (author comments in brackets)
Jansen writes, “The Lower Swatchway Beds are heavily overconsolidated, shallow marine sediments which form pronounced ridges, interpreted as ice pushed ridges.“
(This commentary may be re-interpreted as that the Swatchway Formation is the sediment of a seabed surface which was laid in the last interglacial period, but also in the warm period in the middle of the last ice age (eg 43,000BP). The overconsolidation implies that this has been overlain by an ice sheet since 43,000BP. The pronounced ridges would be the peaks of ridges between palaeovalleys caused by the collapse of ice sheets as they retreated towards Scotland. Reference the parallel valleys shown on the plan.)
“The Upper Swatchway Beds, filling in the hollows between the ridges, are composed of usually normally consolidated glaciomarine Deposits, with locally some probably subglacially folded structures.”
(The Upper Swatchway Beds would be the residue of materials left behind after the collapse of the ice sheet edge and the formation of the ridge/valley complex.)
A tsunami strikes the coasts of England and Scotland

Figure 33 8200BP
The Storegga submarine landslide is known to have swept towards Shetland and Norway in about 8200BP. This caused a considerable height of tidal wave run up as it hit Shetland, but would also have rolled across the shallow sea of the North Sea over the extended Dogger Bank, now submerged, and running up gullies around the Aberdeenshire coasts to leave deposits there.

Figure 34 Storegga submarine landslide
The map above indicates the location map for the submarine landslide close to Norway, and the locations on coastal land of Norway Britain, and elsewhere that are thought to have been transgreessed by a tsunami caused by the landslide.
Archaeological evidence of the presence of Neolithic people in the far north of the North Sea

Figure 35
There is also some physical, archaeological evidence’ that suggests that humans may have been present in the northern North Sea in Neolithic times. A struck flint, that had been worked by humans was found in a boring that was drilled into the seabed of the North Sea, half way between Shetland and Norway. Although it is possible that this artefact was dropped from a boat, it is far more likely that this area was part of a Neolithic landscape, the upper surface of which has been eroded away by the action of Atlantic tidal waters in the North Sea.
In “A flint artifact from the Northern North Sea”. By Long, D., Wickham-Jones, C.R. and Ruckley, N.A. 1986, the authors indicate the find location, and supply a drawing of the flint artefact.
Sediments in the North Sea collapse, causing tsunami waves to land on the Norwegian Coast.
Discussing the Witch Ground, Fred Jansen continues:-
“The foraminifera and the mollusc associations of the Upper Witch Deposits are normal for the present northern North Sea, The striking Increase of the C-N ratios at the top of the Lower Witch Deposits and the introduction of the fine sand mode in the grain size distributions of the Upper Witch Deposits point to an influx of material from a new source and, with regard to the short period in which the thin layer was formed, the source must have been a well definable phenomenon.” (As global sea levels rose the movement of water in the North Sea changed. After 12,000BP it would have been a sheltered Lagoon with its only access to the Atlantic Ocean, between Shetland and Norway, at the North.
This Lagoon would have been subject to tidal surge on a daily basis from the Atlantic Ocean.
At some time after 4000BC the Atlantic Ocean broke through the Dover Strait causing a more complicated pattern of intensive tidal flows to make the North Sea a more violent place, tidally.
This new tidal regime degraded the sediments on the floor of the North Sea causing the submerged west bank of the Norwegian Channel to collapse, sending a tsunami onto the Norwegian coast at Rogaland.)

Figure 36 plan of Norwegian Channel
In the floor of the Norwegian Channel is a raised area of seabed that has been dumped in recent geological time.
The plan above indicates the location of a section along the Norwegian Channel. The arrow indicates the location of a dump of material, as detailed on the section drawing, Figure 37 below.
The raised heap of sediment has been dumped on the floor of the channel at the right hand end of the drawing.

Figure 37 section of deposits along the Norwegian Channel

Figure 38 bathymetry of Norwegian Channel
The bathymetry plan of the Norwegian Channel, by Ottesen, shows the contours of the sea floor, and the relationship between the shallowest water and the Witch Ground, and Scotland.
A local tsunami transgresses a beach in Rogaland, Norway
The substantial deposit of sedimentary material in the Norwegian Channel is likely to have arrived after the final glacial meltwater drained from Europe. It covers a deep erosive gutter, probably of glacial origin, that cuts the seabed along the full length of the Norwegian Coast of the Norwegian Channel.
The date at which this substantial deposit may have been laid may be found in a report of excavations of raised beaches on the Norwegian Coast that was carried out by Lisbeth Prøsch-Danielsen. (Sea-level studies along the coast of south-western Norway, by Lisbeth Prøsch-Danielse)
She demonstrated that there were a couple of transgressive rises in sea level after the end of the last ice age. She also found an anomalous event which she could give no explanation for, in which an alder tree was ripped from its roots at a site in Rogaland, near Stavanger. “The layer consisted of organic and sand (mica schist) lenses sandwiched on top of each other, dipping towards east. Between layer 3 and layer 4 there is an erosional angular unconformity. Also roots of black alder (Alnus glutinosa) (identified by Aud Simonsen) penetrating into the upper part of the marine gyttja have been cut of discordantly. A piece of root has been dated to 4320±70 yr BP (ß-171185).”. The date was calibrated to just after 3000BC, and I interpret that the roots may have been stripped of their tree by a very local tsunami wave, rolling across the Norwegian Channel.
The position of this coastal region of Norway which makes it likely to have been affected by such a wave is exactly opposite the narrowest neck of land between the Witch Ground Lake and the Norwegian Channel.
The Sandy Riddle

Figure 40

Bathymetric maps of the Pentland Firth, and the Northern North Sea, showing Sandy Riddle, South of South Ronaldsay.
Unusually, this area of coastal seabed is shallow in comparison to almost any other sea floor around the Scottish coasts.
It is highly probable that prehistoric people and animals used a route here from South Ronaldsay to the north coast of Scotland to migrate from Scotland to Orkney and Shetland before 3000BC.
People and animals that had been nomadic and migratory were then cast away on small windswept islands on the North Atlantic Ocean.
The isolation of a small population of people led to the creation of some of the most evocative Neolithic structures in Britain.
Sources :-
I have used the evidence published in the sources I have quoted. The interpretation that I draw from their evidence is entirely my own, and I apologise to any authors whose work has been reinterpreted in this way.
(BGS) British Geological Survey, North Sea Memoirs
(Cotterill) “The evolution of the Dogger Bank, North Sea: a Complex history of terrestrial, glacial and marine Environmental change “ Carol J. Cotterill, Emrys Phillips, Leo James, Carl Fredrik Forsberg, Tor Inge Tjelta, Gareth Carter, Dayton Dove
(Cucchi) Analyses of the vole remains, by Thomas Cucchi et al
(Dobney) :- Abdn.ac.uk/news/4846 “Revealed: Unique Orkney Vole most likely came from Belgium over 5,000 years ago” “The mystery of the Orkney Vole,” June 2016, Keith Dobney, et al ”
(Gatliff) The geology of the central North Sea. United Kingdom offshore regional report by R W Gatliff
(Hijma) "Global sea-level rise in the early Holocene revealed from North Sea peats" by Marc P. Hijma, Sarah L. Bradley, Kim M. Cohen, et al
(Howar) Geology of the Nottingham district: Memoir for 1:50 000 geological sheet 126 (England and Wales)” By A S Howar
(Johnson et al) The geology of the northern North Sea. United Kingdom Offshore Regional Report By H Johnson, P C Richards, D Long and C C Graham
(Jansen ) Late Pleistocene and Holocene deposits in the Witch and Fladen Ground area, northern North Sea” Fred Jansen
(Long, D) ., Smith, D. E. And Dawson, A. C. 1989 A Holocene tsunami deposit in eastern Scotland. Journal of Quaternary Science, Vd. 4, pp. 61-66. ISSN 0267-81 79 1988
(Mellett) Denudation of the continental shelf between Britain and France at the glacial-Interglacial timescale · December 2013 Claire L. Mellett
(Ottesen) “Morphology, sedimentary infill and depositional environments of the Early Quaternary North Sea Basin by Dag Ottesen
(Prøsch-Danielsen) Sea-level studies along the coast of southwestern Norway with emphasise on three short-lived Holocene marine events Lisbeth Prøsch-Danielsen
(Roberts) The mixed‐bed glacial landform imprint of the North Sea Lobe in the western North Sea”, by Dave Roberts.
(Sejrup) Quaternary of the Norwegian Channel: glaciation History and palaeoceanography” Hans Petter Sejrup
(Shennan) . “Relative sea-level changes and crustal movements in Britain and Ireland since the Last Glacial Maximum by Ian Shennan , Sarah L Bradley, and Robin Edwards”
(Stewart) Assemblage of buried and seabed tunnel valleys in the central North Sea: from morphology to ice-sheet dynamics, M.A. STEWART
This is one of a loosely attached group of blogs called the "Orkney Riddle".
The key blog to the group is called the "Neolithic Immigrants to Britain"
(All views and opinions expressed in Orkney Riddle are my own)
Jeffery Nicholls
South Ronaldsay
Orkney


Comments
Post a Comment